Project logs#
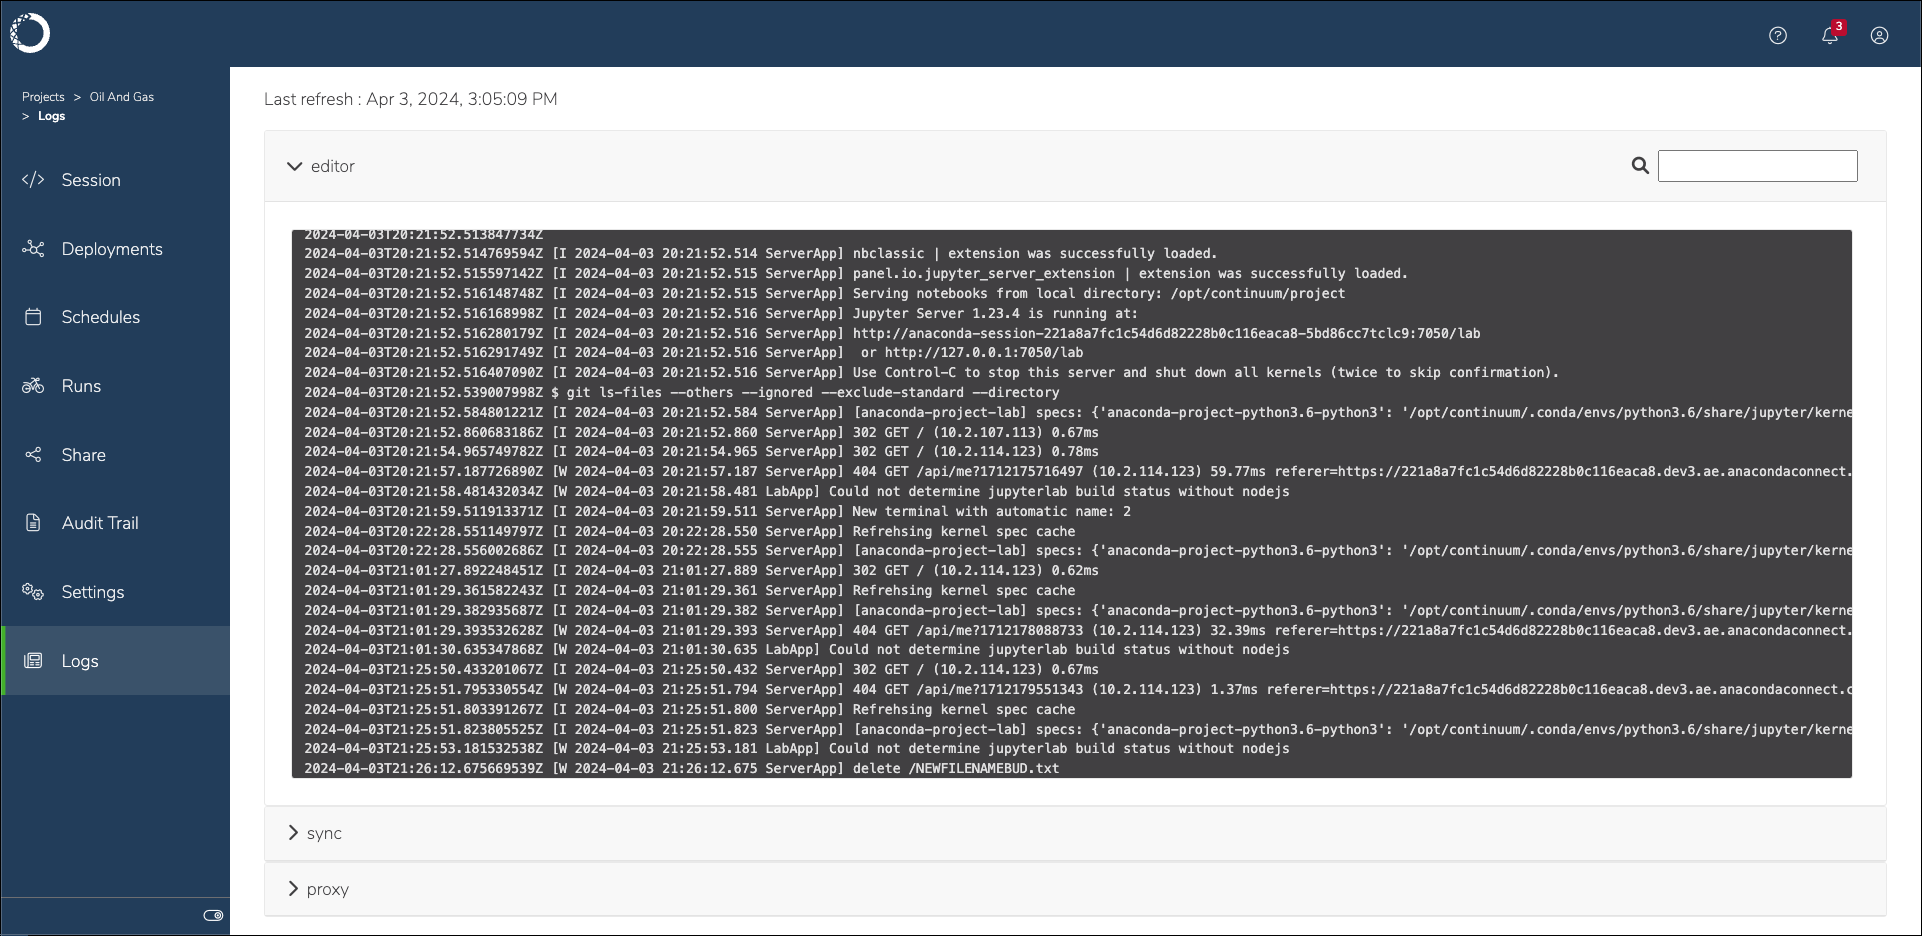
Because Data Science & AI Workbench is built on top of a Kubernetes cluster, each project session is created as a pod. Each project session pod has an editor, sync, and proxy container, and logs for each container are accessible to aid you in troubleshooting issues you may encounter with your project. These logs can provide insights to the operational health of your project, possible configuration errors, and potential security issues.
Viewing project logs#
To view a project session’s logs:
Log in to Workbench.
Open a project.
If necessary, start a session in the project.
Select Logs from the left-hand navigation.
Open a container dropdown to view the logs for that container.

Tip
Use the search function to help you efficiently locate information in the container logs.
Editor container logs#
The editor container is where the integrated development environment (IDE) set by the project configurations runs. Logs from this container can provide insights into the following:
User actions performed within the editor, such as file edits, saves, and execution of code cells
Errors or warnings related to the editor software, as opposed to Workbench software
Problems that are caused by editor plug-ins or extensions
Sync container logs#
The sync container is responsible for synchronizing project files and code between persistent storage and the editor. Logs from this container can provide insights into the following:
Successes or failures when syncing files between the local user repository and the projects remote repository
Issues encountered during file creation or deletion, or file modification attempts
Problems accessing external resources the project relies on
Proxy container logs#
The proxy container handles network traffic to and from the project’s environment, and facilitates access to web interfaces and APIs. Logs from this container can provide insights into the following:
Incoming and outgoing network requests, which is useful for identifying unauthorized access attempts
Errors related to network connectivity, DNS issues, or failed attempts to connect to external services
Information on request handling times and bottlenecks in network communication